In April 2013 the world discovered an error in an important piece of work which has caused two very senior academics to look very foolish, the politicians and economists from one of the world’s superpowers to look lazy (what- no one checked the advice they were given?!), over-trusting and a little incompetent, and one of the world’s most popular vehicles for manipulating small number sets to look decidedly shaky.
There has been a lot written about the incident by all the heavyweight analysers- New Scientist, the BBC, Huffington Post, Business Week, Washington Post, the Economist- it seems everyone who has a business page has put in their two cents, with loads of finger-pointing and beard-stroking and plenty of ‘wise-after-the-fact’ analysis.
As a reminder, the details of the incident are thus: in 2010 two Harvard professors (one who was the chief economic advisor to the IMF) published a paper showing that America needed to adopt tough austerity measures to beat the world recession. This idea was presented to Congress who acted swiftly- trying to reduce public debt at the expense of not stimulating market increases- basically pushing a ‘belt-tightening’ policy to both the nation as a whole and the American people as individuals.
Three years later some rival academics from a different university (the University of Massachusetts if you must know) reviewed the original calculations and spotted mistakes.
Sloppy mistakes.
A quarter of the data for one part of the calculation had been erroneously missed because someone hadn’t pulled a formula on an Excel sheet to the bottom of a column. Oops.
The witch hunt took two simultaneous directions, depending on political agenda / nerdiness of reviewer / perceived interest level of audience.
1) Excel is difficult to use: 88% of all excel spread sheets have 1% or more errors in their formula cells (2008 review from an IT professor at University of Hawaii which was seized upon to illustrate this point) followed by lists of high profile errors which have a root somewhere in Excel, such as the botched West Coast Main Line bid process- £40 million public money down the drain; JPMorgan Chase operators put the wrong figures in an excel spread sheet which ultimately lead to £3.1 billion lost due to poor investment choices; in 2008 when Barclays bid to buy the recently deceased Lehman Brothers (a global financial company which went belly up following years of dodgy accountancy) they did so with an excel spread sheet. This spread sheet had 200 cells hidden- however when it was converted into PDF for the actual bid the figures became visible and Barclays ended up with 179 toxic accounts it never intended to bid for. Oops! Seemingly just opening an excel document is likely to make all your numbers corrupt before your very eyes.
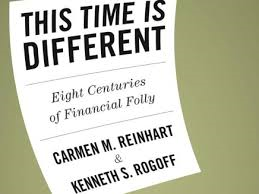
2) The Harvard authors used inflammatory language to drive resolutions based on their perception of the results (regardless that there were errors in the results). For a start the original report was titled “This Time is Different”, inferring that any historic learning needed to be ignored and their solution picked up instead. This was followed by an interesting choice of language depending on audience. In their original paper (intended primarily for academics and economists) they point to an association between high debt and low growth. However when they talked about the paper this language turned from a simple correlation (there are more cases of sunburn in the summer, and more butterflies are seen in summer, but that does not mean butterflies cause sunburn) into a causal relationship- high debt causes low growth- especially when talking to politicians such as in a 2011 Congress briefing (cited by Senator Tom Coburn). This degree of overhyping has resulted in one distinguished economic commentator labelling the pair “the most dangerous economists in the world”. And that’s before we consider the other errors noted by the Massachusetts crew- an ‘unconventional’ weighting system and ‘selective’ data inclusion that the reviewers just fall short of describing as deliberate manipulation. Did I mention the incorrect data in the set too?
So what should we learn from this case- if anything?
Excel is easy to use– if you know what you are doing, and take care to double check your working. Just like with any endeavour. And if the task is appropriate to be done in Excel. Because it allows you to work out raw data and calculations in the same space (unlike MS Access, for example) it is easy to ensure you are using all the data you want. You can also easily split complicated ‘nesting queries’ into separate components to ensure you get each bit right. You can also perform multiple calculations are the same time, and although there are other presentation vehicles available it is possible to design and build professional-looking dashboards and reports in Excel.
The case of the Harvard paper shows errors that are all human in origin- not a fault of Excel. Not dragging a formula into all the right boxes, using questionable calculations and inputting incorrect data are the fault of the user. This leaves three potential causes which are not mutually exclusive.
a) Incompetency with the user. Yes, these were economics professors, but does that mean they know everything about Excel? Hands up if you’ve ever been on an official Excel training course? Thought not. The principle method of learning Excel is trial and error, and learning from more experienced colleagues. If companies insist on using a product it would seem sensible to arrange suitable product training. But using Excel is not just about using a product- you also need to know the fundamentals of number manipulation. What is the significance of excluding non-fit data, or rounding data, or aggregating elements of data? Hold that thought- we’ll come back to it shortly.
b) Carelessness of the user. To err is human, to err but not spot and fix it is poor working practice and / or lazy, particularly if you intend to go public with your interpretations on a global scale. The lack of notation within Excel documents may well contribute to the lack of transparency and ongoing checking of calculation integrity. The standard practice for web design, for example, is for all coding to be accompanied by notation so other designers can follow the flow and reasoning of code when they want to replicate / repair / amend. Another option is to add in calculation checks. Excel is stuffed full with ‘count’ variations to allow you to check how many items of data you are processing, highlight any errors within chains of calculations or data inputs etc. Building these safety checks into every worksheet would reduce any errors like that cited for the Harvard paper where 25% of the data wasn’t included in the calculations.
c) Deliberate manipulation of data or calculations to orchestrate a specific outcome. There is no way to dress this up- this is fraud, and it happens from the most insignificant activity (a friend who enjoyed jogging would routinely knock +30 seconds off his run times to account for delays when crossing a road) up to obscuring billion dollar losses by Olympus, the Japanese technology company, and the current furore surrounding Argentina, whom the IMF have threatened with expulsion if they don’t stop falsifying their inflation figures. The effect of this is to undermine confidence in any presented number (“lies, damn lies, and statistics”) and prevents decision-making occurring with correct information (back to the Harvard paper and the US Congress austerity drive). It also leads to sackings, fraud prosecutions, financial hardship, international tension and the mistaken belief that you have just broken the world record for the mile.
Excel (and its replacement option, PowerPivot) is relied on by so many people across different industries because it is easily accessible and functionally powerful. However it is only a tool and therefore it needs the user to know how to use the tool effectively, how to work with number effectively, and how to remain impartial. As we move increasingly into data-lead decision-making we have to have the strength to trust the data to describe current state and determine strategy.
 Getting yourself and your people professionally trained to use excel will go a long way to preventing some of the catastrophic incidences described above happening to you, and will also allow you to get even more out of this common and useful tool. Being aware of what can happen when things go wrong will help you avoid the same mistakes- being aware of just how much you can easily do in excel will help you optimise your usage, and get even more out of it.
Give us a call or e-mail to discuss how we at Prosperity 24.7 can help your business on+44 (0) 1534 877247 or enquiries@prosperity247.com.
Prosperity 24.7 offer Excel training in a variety of levels to suit all users, delivered by our highly experienced training team. Please click here to check the course contents and to arrange training for your company.


