Apart from being visually pretty, why do we need graphs…?
Because sometimes groups of numbers can behave in very similar ways, but are actually very different!
The graphs below all have the same mean of x, mean of y, the same variance of x, the same variance of y, the same correlation co-efficient, and the same linear regression- but have distinctly different dispersal patterns and therefore tell distinctly different stories about their sources.
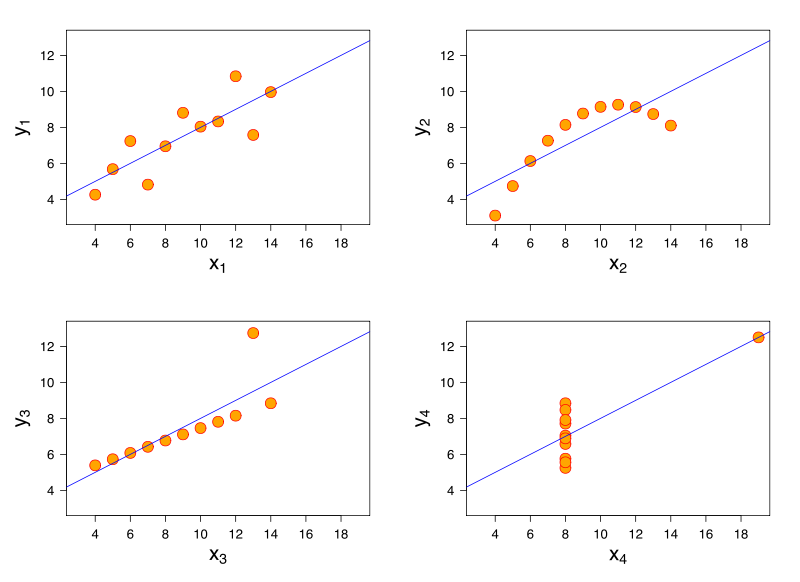
All four sets are identical when examined using simple summary statistics, but vary considerably when graphed
This is called Anscombe’s Quartet after the mathematician who developed the observation in the 1970’s.


